Engineering Internship in QA team, Merck Healthcare, 6 months (ongoing)
Keywords: LLM/VLM, AI Architecture, Document Understanding, Quality Assurance, Task Assistance, Data Pipeline
Architecting AI for QA: Task Assistance Pipelines and Digital Upskilling at Merck
During my final-year engineering internship at Merck Biotech Development Center, I am spearheading the design and implementation of AI-driven task assistance tools for Quality Assurance. The core mission is to architect systems that significantly accelerates processes for the team.
Contributions:
System Architecture: Designing end-to-end data pipelines for secure ingestion, processing, and storage of highly unstructured QA documentation.
Document Understanding Pipeline: Architecting parsing and extraction pipelines to process complex regulatory documents and surface critical data.
Workflow Optimization (Task Assistance): Developed intelligent discrepancy detection systems designed to guide human attention and assist operators.
Digital Transformation & Training: Will give training programs to upskill teams on emerging digital tools to improve their daily operational workflows.
Keywords: CNN, GAN, U-Net, MLFlow, AI Training, ASAM standards
Developing AI-Driven Scenario Generation for Autonomous Vehicles
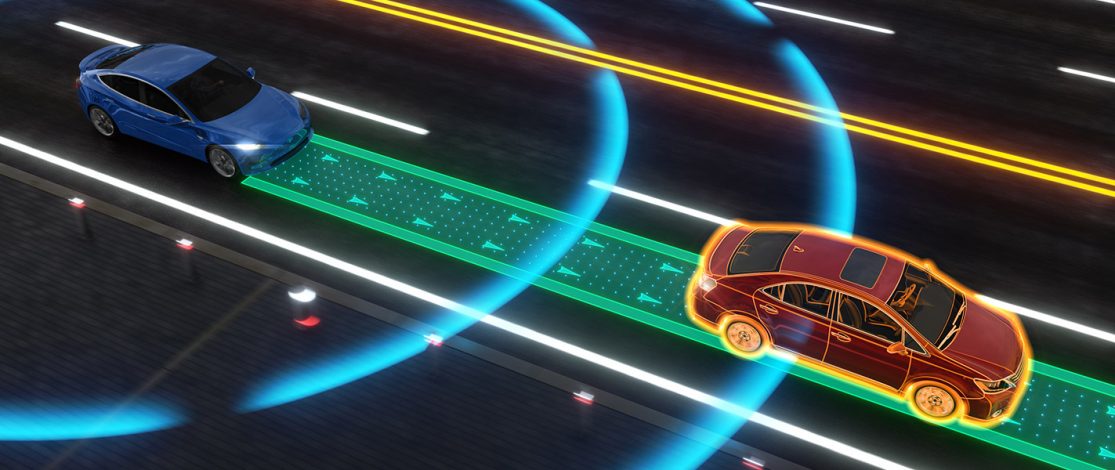
In this internship at CEA-List, I developed and validated systems for autonomous vehicles by creating an automated scenario generation pipeline. My work focused on addressing the limitations of traditional, manual methods by leveraging advanced AI techniques to create a wide range of realistic and complex driving scenarios.
Contributions:
Massive Dataset Analysis: I processed and analyzed massive real-world driving datasets to inform the development of robust scenario generation models.
AI-Based Scenario Generation: I designed and implemented innovative algorithms using PyTorch to generate diverse and realistic driving scenarios. This included leveraging Generative Adversarial Networks (GANs) and U-Net architectures to capture complex real-world variability. This involved using high-performance compute platforms for training models.
Simulation Integration & Validation: I integrated the developed methods into simulation environments (CARLA), enabling the testing of autonomous vehicle systems under virtual conditions.
Collaborative Development: I collaborated with a team to evaluate the results and refine the scenario generation methods.
Results:
An end-to-end pipeline, from road layout input (OpenDRIVE) to scenarios (OpenSCENARIO).
[PrePrint, WIP] Detection and Classification of Red Blood Cells under flow
Keywords: CNN, YOLO, ResNet, Data augmentation, normalization, high performance computing, dataset, domain gap, biology.
Active project. Manuscript available in preprint. Currently reformatting for journal submission.
Source code and further details available on GitHub.
Detection and Classification of Red Blood Cells under flow
This semester project aimed to solve the domain gap problems in AI applied to biology for red blood cells detection and classification.
The specificity is the target domain: red blood cells under flow, an under-studied field, lacking data and AI models. Yet, analyzing the shapes of RBC under flow helps understand and detect diseases. Project conducted at Biomechanics and Bioengineering Laboratory (UMR 7338).
Introduction
This study conducted a comprehensive investigation into the detection and classification of red blood cell morphologies, in particular of “slipper” and “parachute” shapes under flow conditions, exploiting the YOLOv11 framework. A significant part of this work focused on addressing the challenge of data sparsity and bias between datasets through the strategic construction of different datasets.
To counter the prevailing problem of data sparsity and improve the generalisation of the model, the study ventures into the generation of multiple-cell datasets through a cut-and-paste augmentation technique.
Contributions
Construction of a general data set to extend training domain. This involved working with other univerisities, studying data augmentation and normalization techniques, and developping labelling algorithms.
Training a YOLO model on this new data set using a superchip.
Analysis: in depth analysis of the model's behaviors on different data. How does it react to data out of training domain, to new backgrounds, to different color ranges?
Results
A new data set has emerged of this work, gathering data from multiple sources and acquisition techniques.
YOLOv11 has been evaluated and interesting behaviors emerges from this architecture.
The performance of YOLOv11 is evaluated both on the Saarland University dataset, where the focus is on accurate cell type classification, and on the Naples University dataset, which is primarily aimed at differentiation between cells and background. On the Saarland University dataset, the model shows excellent performance for the distinct class “parachute”, consistently achieving high recall. When compared to the Naples dataset, characterised by significant colour shifts in the image, the YOLO model shows significant difficulties. It consistently produces high false negative rates, failing to detect a large percentage of real cells and showing high false-positive rates due to misinterpretation of the background.
Overall, these results demonstrate that YOLOv11, despite its strong performance within training-data-like environments, exhibits significant limitations in its generalization capabilities when confronted with substantial discrepancies in visual characteristics. This underscores the inherent challenge in constructing a single, comprehensive data set capable of encompassing the vast array of diverse scenarios encountered in the microscopy domain.
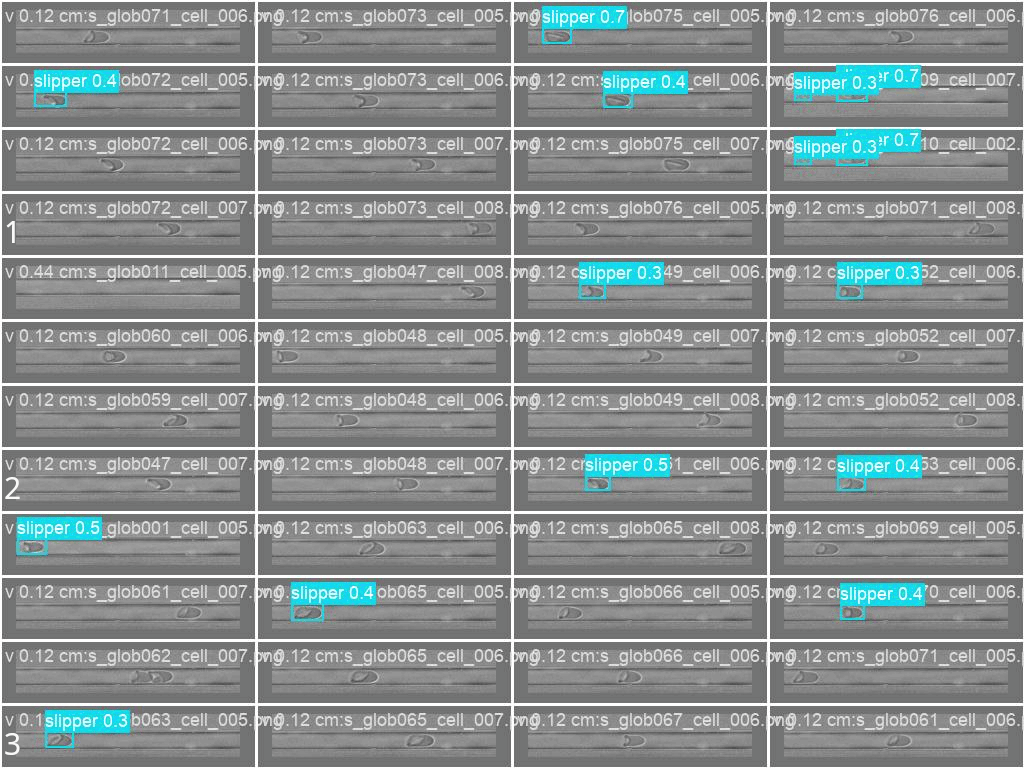
Evaluation on Saarland University videos. The model was trained with randomly placed cells, no overlap and three classes (croissants, slippers, others). The model manages to detect cells and classify them properly.
Evaluation on Naples University data. The provided images have vastly different characteristics compared to training data: the cells are more elongated, the image color range is different and the color expression is different as well (cells do not have a white halo-border). A model trained on the same data as before struggles to detect these cells. Future works should create ground truth labels for this data and incorporate these images in the training data.
Acknowledgement
The authors would like to thank Prof. Giovanna Tomaiuolo and Prof. Stefano Guido of the Università degli Studi di Napoli Federico II; Prof. Christian Wagner, Prof. Lars Kästner, and Dr. Mohammed Nouaman of the Universität des Saarlandes; and Prof. Ye Ai of the Singapore University of Technology and Design for kindly sharing their datasets and granting permission for their use.
Professors C. Wagner and Y. Ai notably granted us access to the data of the following publications:
A. Kihm, L. Kaestner, C. Wagner, and S. Quint, Classification of red blood cell shapes in flow using outlier tolerant
machine learning, PLoS Computational Biology, vol. 14, no. 6, p. e1006278, 2018. doi:10.1371/journal.pcbi.1006278.
M. Liang, J. Zhong, C. S. Shannon, R. Agrawal, and Y. Ai, Intelligent image-based deformability assessment of red blood cells via dynamic shape classification, Sensors and Actuators B: Chemical, vol. 401, p. 135056, 2024. doi:10.1016/j.snb.2023.135056
The authors also wish to thank Dr. Imad Rida, Ms. Alaa Bou Orm, and Prof. Amine Nait-Ali for their valuable support and for providing the opportunity to present this work at BioSMART—the 6th International Conference on Bioengineering for Smart Technologies.
Citation
@article {Amrani2025.09.18.677048,
    author = {Amrani, A. and Caridi, I. and Kaoui, B.},
    title = {Deep Learning Detection and Classification of Red Blood Cells: Towards a Universal Dataset},
    elocation-id = {2025.09.18.677048},
    year = {2025},
    doi = {10.1101/2025.09.18.677048},
    publisher = {Cold Spring Harbor Laboratory},
    URL = {https://www.biorxiv.org/content/early/2025/09/20/2025.09.18.677048},
    eprint = {https://www.biorxiv.org/content/early/2025/09/20/2025.09.18.677048.full.pdf},
    journal = {bioRxiv}
}
[Project] AI Grand Challenge 2026 — The Thinking Layer
Keywords: FastAPI, Multi-Agent, RAG, Supabase, Qdrant, Arq, Redis, System Resilience, Sovereign AI
June 2026 Update: Our project finished 2nd for the jury vote! 🥈🏆
Overview
Developed for the AI Grand Challenge 2026 by the UTC EduTech team, this project introduces The Thinking Layer — a fundamentally different approach to educational AI. Instead of acting as a frictionless answer-engine, the system serves as a "Cognitive Mirror" that treats the student as a thinker to be provoked, rather than a vessel to be filled. Demo application here.
Scientific Foundations
The system is built on established pedagogical frameworks:
Desirable Difficulties (Bjork & Bjork): Recognizing that learning is most effective when it requires cognitive effort.
Productive Failure (Kapur): Encouraging students to struggle with problems before receiving direct instruction to deepen structural understanding.
Socratic Tutoring: Using fine-tuned smaller models to guide students through reasoning rather than delivering facts.
The Core Idea: The Thinking Layer
Most students use AI as a shortcut. Our system acts as a processing stage between the student and the LLM, calibrating the AI's posture based on the student's actual learning state.
The Dynamic State Classifier: Detects engagement levels in real-time (EXPLORING, SHORTCUTTING, STUCK, or BREAKTHROUGH).
Pedagogical Steering: If a student tries to "shortcut" the thinking process, the system redirects them; if they are genuinely stuck, it provides scaffolding.
Cognitive Mirroring: Maintains a structured, legible, and editable Metacognitive Profile for each student to target their Zone of Proximal Development.
Technical Architecture & Engineering
The backend is designed for pedagogical precision with multi-agent orchestration.
Engineering for Resilience
Multi-Provider Fallback: We implemented a custom FallbackOpenAIClient that manages a priority-based chain of LLM providers. It handles automatic retries and transparent mid-stream fallback for failed function calls, ensuring availability. Sovereignty will later require national-scaled infrastructure as ILaaS.
Asynchronous Processing Pipeline: To maintain API responsiveness, expensive operations like document summarization, memory compression, and learner profile updates are offloaded to a task queue (Arq + Redis).
Agentic RAG Strategy: Retrieval is not limited to a single course context. The system performs multi-course searches across both institutional materials and personal student libraries using MatchAny filtering, providing a unified knowledge base for the agent.
Tools: Both supervisor agent and subagents have tool calling to generate learning plan, access user profile and access PDF content.
Misc.: we first used openai-agents SDK (and wrapped it in a FallbackOpenAIClient), but we are now moving to pydantic-ai SDK.
Multi-Agent Orchestration
The system employs a modular agent framework:
Supervisor Agent: Orchestrates the dialogue, dynamically composing system prompts from five distinct layers (Context, Document Summaries, Base Socratic Instructions, Pedagogical State, and Verbosity Style).
Specialized Sub-Agents: Dedicated agents handle RAG retrieval, profile editing, exercise generation, and per-step pedagogical feedback, allowing for independent testing and prompt optimization of each component.
The Stack
Layer
Technology
Purpose
Backend
FastAPI (Python)
Async REST API with SSE streaming.
Resilience
FallbackOpenAIClient
Custom multi-model chain for availability.
Task Queue
Arq + Redis
Distributed async workers for background processing.
Vector Store
Qdrant
Optimized RAG with metadata filtering.
Persistence
Supabase
Relational data, JWT Auth, and state persistence.
Metacognitive Student Profiles
The system maintains a profile_json that adapts the AI's behavior to each student's reasoning style and progress:
"Friction is not the enemy of learning; friction is learning. We treat AI not as a servant that performs tasks for us, but as a companion that makes us perform tasks better."
A view of a learning plan, focused on an item asking the student to read a specific section of a course material.
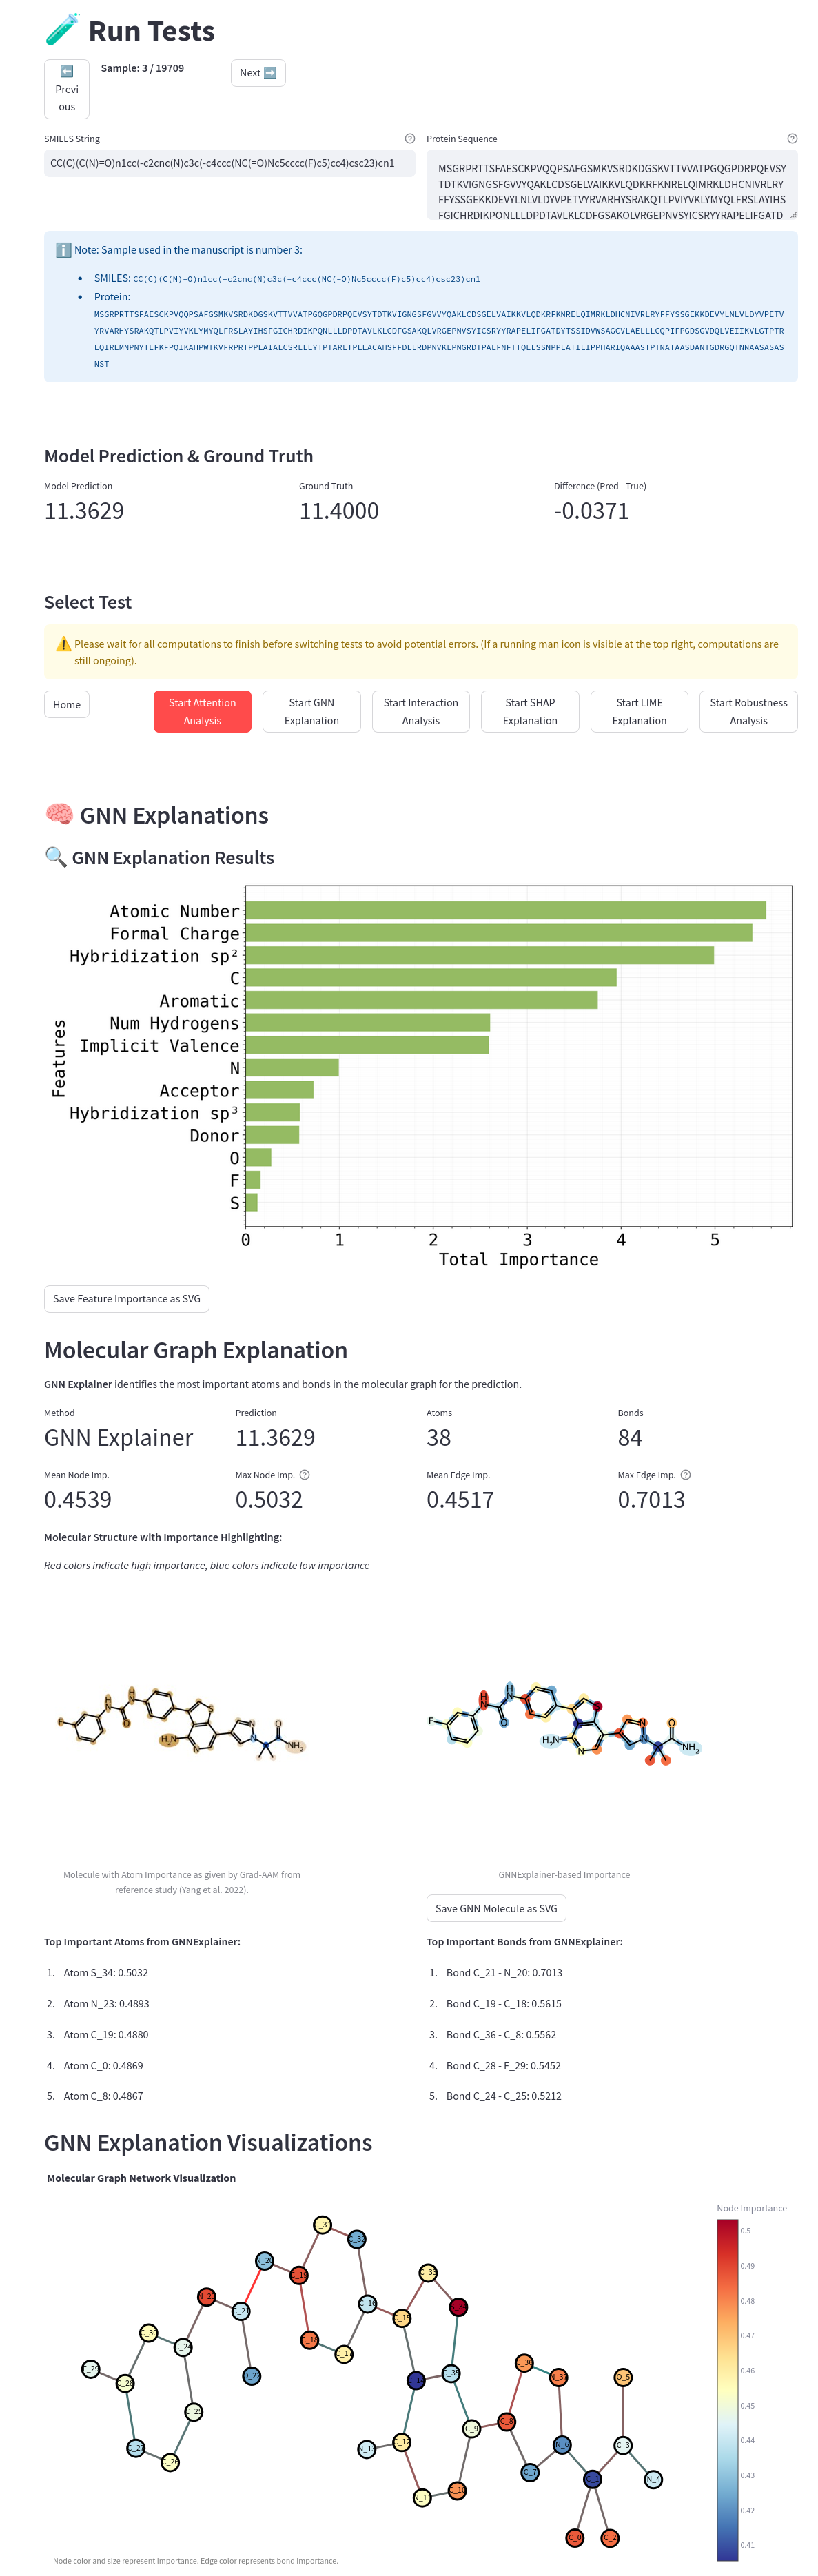
Deep learning models excel at predicting drug-target affinity but operate as "black boxes," creating a serious obstacle when computational predictions need to guide real experimental work. Without understanding why a model predicts high affinity, computational chemists and biologists cannot trust or validate its recommendations.
Semester project extending MGraphDTA model (Yang et al., 2021) capabilities with enhanced explainability and latent space analysis.
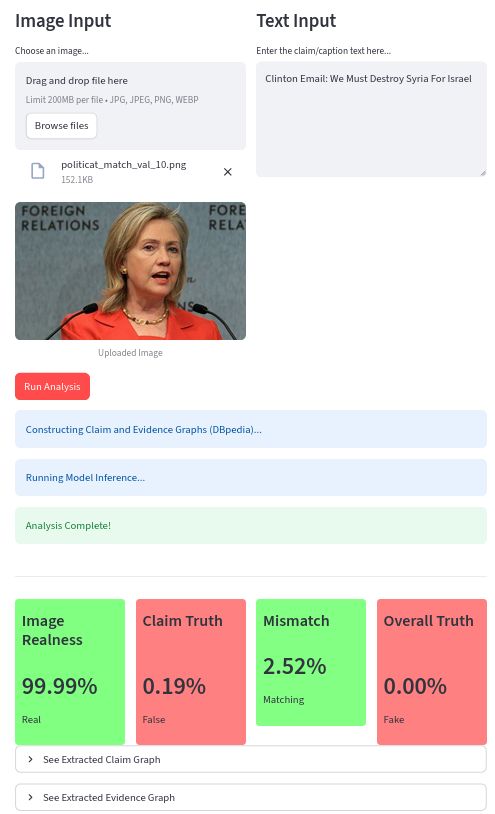
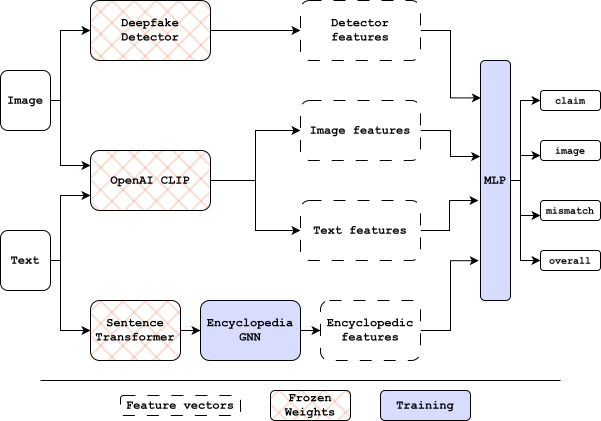
A deep learning framework for detecting misinformation in social media posts by analyzing visual authenticity, semantic consistency, and factual veracity simultaneously. This system addresses the growing challenge of "out-of-context" misinformation where authentic images are paired with false or misleading textual narratives.
Problem Statement
Traditional misinformation detection systems focus on single-modality violations (either fake images OR false text), failing to address real-world scenarios where:
Authentic images are paired with fabricated claims (cross-modal mismatch)
Deepfake images support true statements (visual manipulation)
The system must disentangle these three distinct types of deception while avoiding "search pollution" where web-based verification retrieves the very misinformation being investigated.
NLP: spaCy dependency parsing, Sentence Transformers (all-MiniLM-L6-v2) for node embeddings
Graph Metrics: PageRank, Edge Betweenness Centrality, Jaccard similarity for structural features
Results
Evaluated on MMFakeBench and COSMOS datasets:
Task
Best Accuracy
F1 Score
Factual Claim Verification
98.5%
98.9%
Deepfake Detection
99.2%
99.5%
Cross-Modal Mismatch
94.8%
94.7%
Overall Truthfulness
83.5%
73.8%
Innovations
DBpedia-based Evidence Graphs: Avoids web search pollution by constructing knowledge graphs from curated encyclopedic sources
Multi-Task Decomposition: Provides explainable outputs for each deception type (visual, semantic, factual)
Enhanced Graph Construction: Improved predicate filtering and semantic expansion over baseline EGMMG architecture
Claim verification branch based on EGMMG pipeline: Duwal, S., Shopnil, M. N. S., Tyagi, A., & Proma, A. M. (2025). Evidence-Grounded Multimodal Misinformation Detection with Attention-Based GNNs. arXiv. https://doi.org/10.48550/arXiv.2505.18221
[Project] High-Resolution Urban Climate Forecasting with Metadata-Augmented U-Net
Keywords: Multi-modal Deep Learning CNN, RNN/LSTM, Sentinel-2, Google Earth Engine, Urban Planning, Satellite Imagery.
Example of a part of the system's input: RGB map (Sentinel 2), Labelled map (Google Earth Engine Dynamic World), Temperature map (Landsat 7).
Project Overview
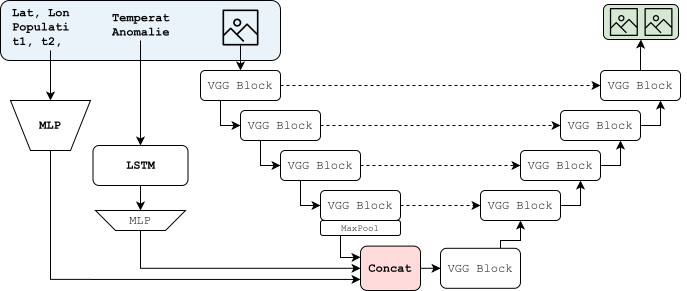
A data-driven deep learning framework for predicting the microclimatic impact of urban land-use changes. The system forecasts high-resolution Land Surface Temperature (LST, 30m) and Normalized Difference Vegetation Index (NDVI, 10m) maps based on proposed urban modifications, enabling city planners to quantitatively assess green infrastructure interventions before implementation.
Problem Statement
Urban Heat Island (UHI) effects pose significant environmental challenges as cities expand. Traditional physics-based simulations (CFD, WRF, ENVI-met) are computationally prohibitive for rapid scenario testing. This project addresses the need for fast, scalable tools that can answer "what-if" questions: How will surface temperature change if we convert this parking lot into a park?
Temporal Modeling: LSTM for 69-year climate anomaly series (CRU TS dataset)
Findings
Contrary to expectations, static metadata outperformed historical time-series:
Model Configuration
LST MAE (°C)
NDVI MAE
Metadata Only
5.332
0.068
Temperature Series
6.937
0.067
No Embeddings
7.113
0.069
U-Net++ (Full)
7.019
0.11
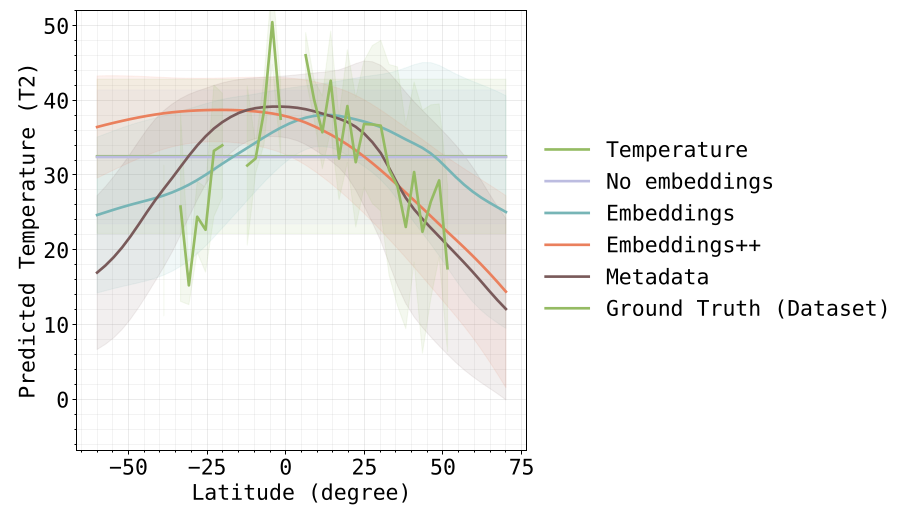
Geographic coordinates serve as effective proxies for climatic zoning, enabling generalization to unseen cities (MAE 4.024°C on unknown locations with long time gaps).
Mean Predicted Temperature according to latitude change. The model understood the link latitude-temperature.
Dataset
137,147 samples across 211 global cities (pop. ≥50k)
Temporal range: 2017–2025
Filtering criteria: NDVI Δ≥0.1, LST Δ≥0.1°C, or LULC change ≥10%
Geographical + temporal train/val/test splits
Demo
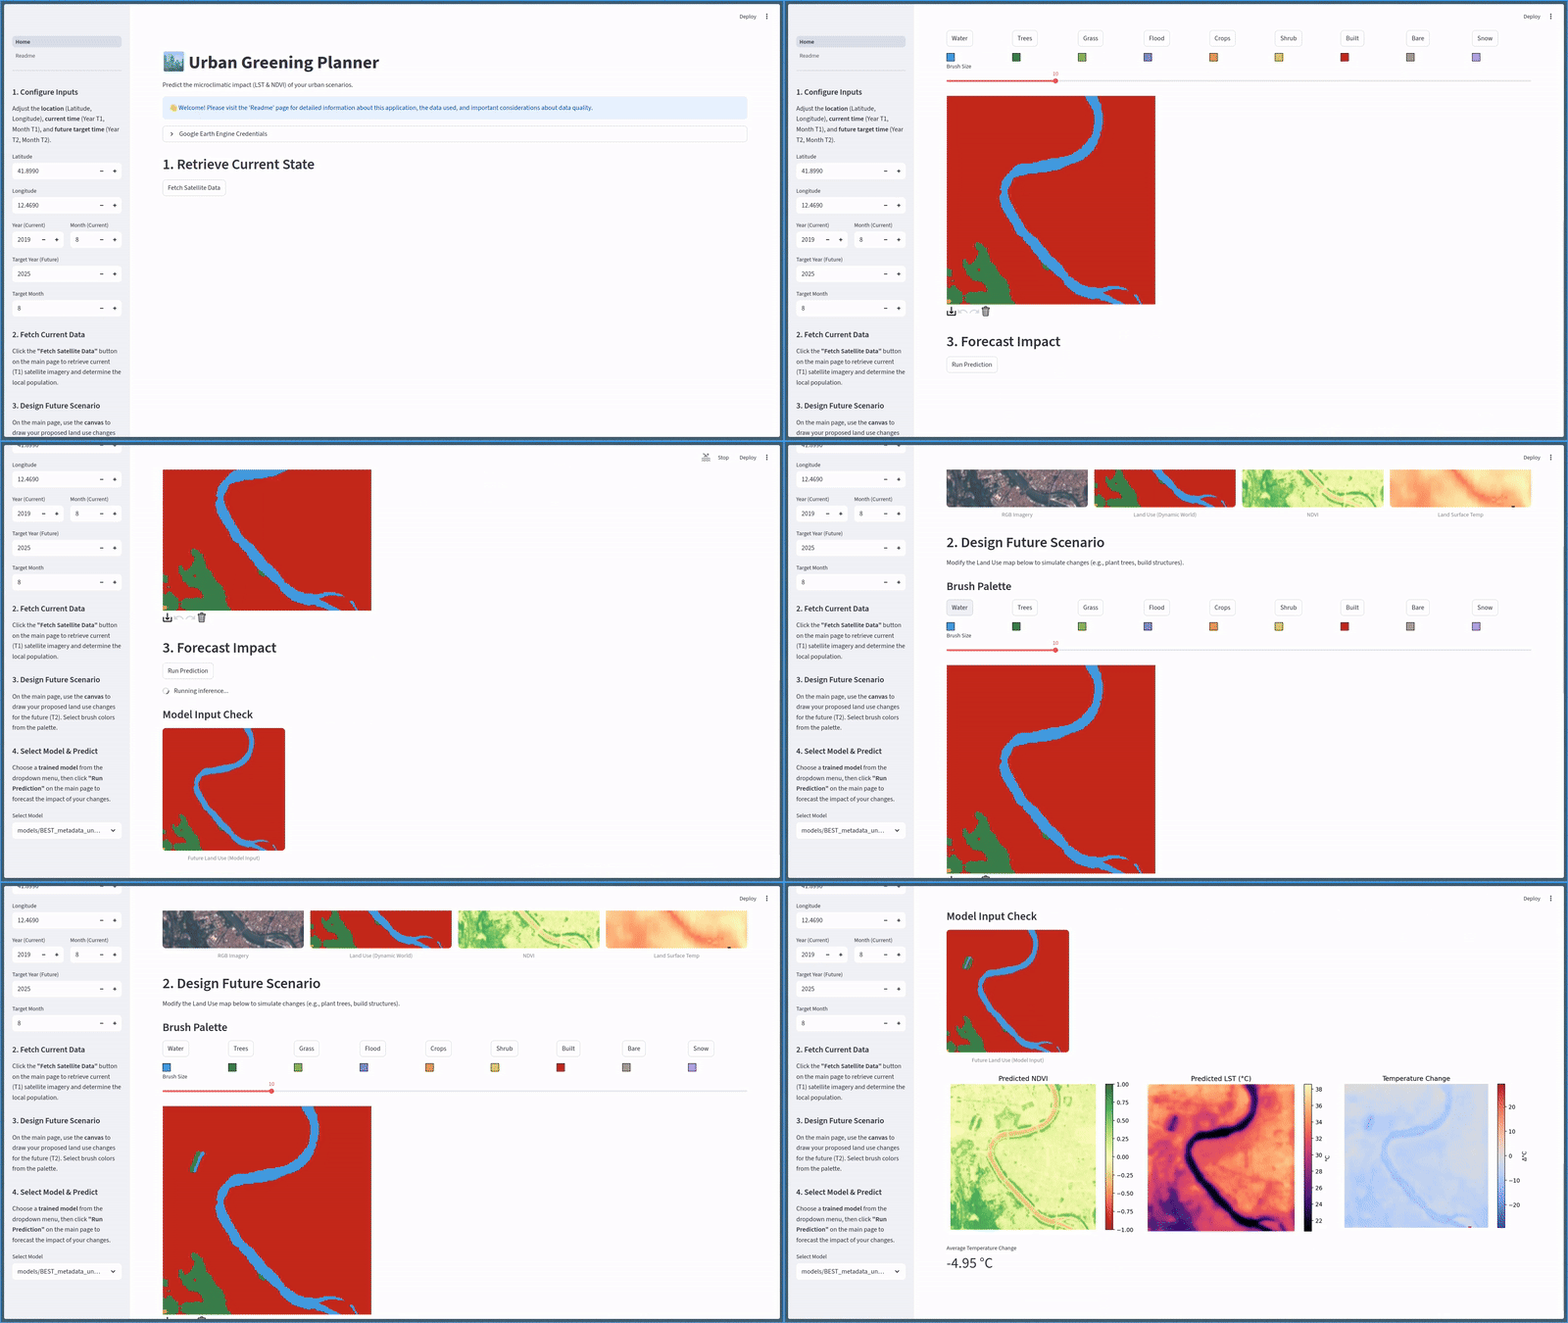
Demo from Hugging Face Space showcasing urban greening scenario predictions based on urban change.
Utilizing Google Earth Engine API and Copernicus Climate Data Store for comprehensive environmental modeling. City metadata data set is the World Cities Database from simplemaps.
[Project] Distributed Data Sharing System (applied to Temperature)
Keywords: Go, distributed system, frontend.
This project implements a fully decentralized distributed system where multiple types of nodes collaborate to collect, verify, and use data across different sites. Written in Go for the group project of the course Distributed systems at UTC.
The system models a real-world scenario where devices collect sensor data, verify its accuracy, and produce predictions, while ensuring correct coordination and consistency across geographically separate nodes.
For educational purpose, it is applied to temperature data: sensors get temperature, and users predict the next day weather based on the 15 days past data. All system's nodes will work on their own copy of this dataset (the 15 past data, 15 past days as working with temperature).
The core idea is that sensors might give erroneous data, perturbating the users. Thus, verifier systems are integrated to update, slowly, each data point one after the other. The goal is to observe the impact of verifier parameters on user behaviors.
Each node maintains a local replica of the shared dataset (past 15 days of temperature readings) and participates in maintaining consistency between replicas using locks and logical clocks.
Key Features 💡
Decentralized Architecture:
No centralized database. All nodes maintain and update their own local replica.
Replica Consistency:
Nodes coordinate using a distributed queue with logical clocks to serialize all updates.
Shared Data Management:
Nodes work on a sliding window of the latest 15 days of temperature readings.
P2P Communication:
Direct messaging between nodes for update propagation and coordination.
Flexible Role Execution:
A single program can run in different node modes (sensor, verifier, or user) based on configuration at launch.
Scenario Example 🎉
Sensor generates a new reading (e.g., 25°C).
It broadcasts the reading to all nodes, including verifiers and users, which will store it in their local data stores.
Verifiers receive the reading and ask for a lock to verify the data. They send a request to all other verifiers.
Once all verifiers grant access, the requesting verifier processes the data (e.g., checks for anomalies) and updates the local data store.
It then releases the lock and sends the verified data to all nodes, including users.
Users receive the verified data and update their local data stores.
Users read all local data to predict the temperature, without needing to lock.
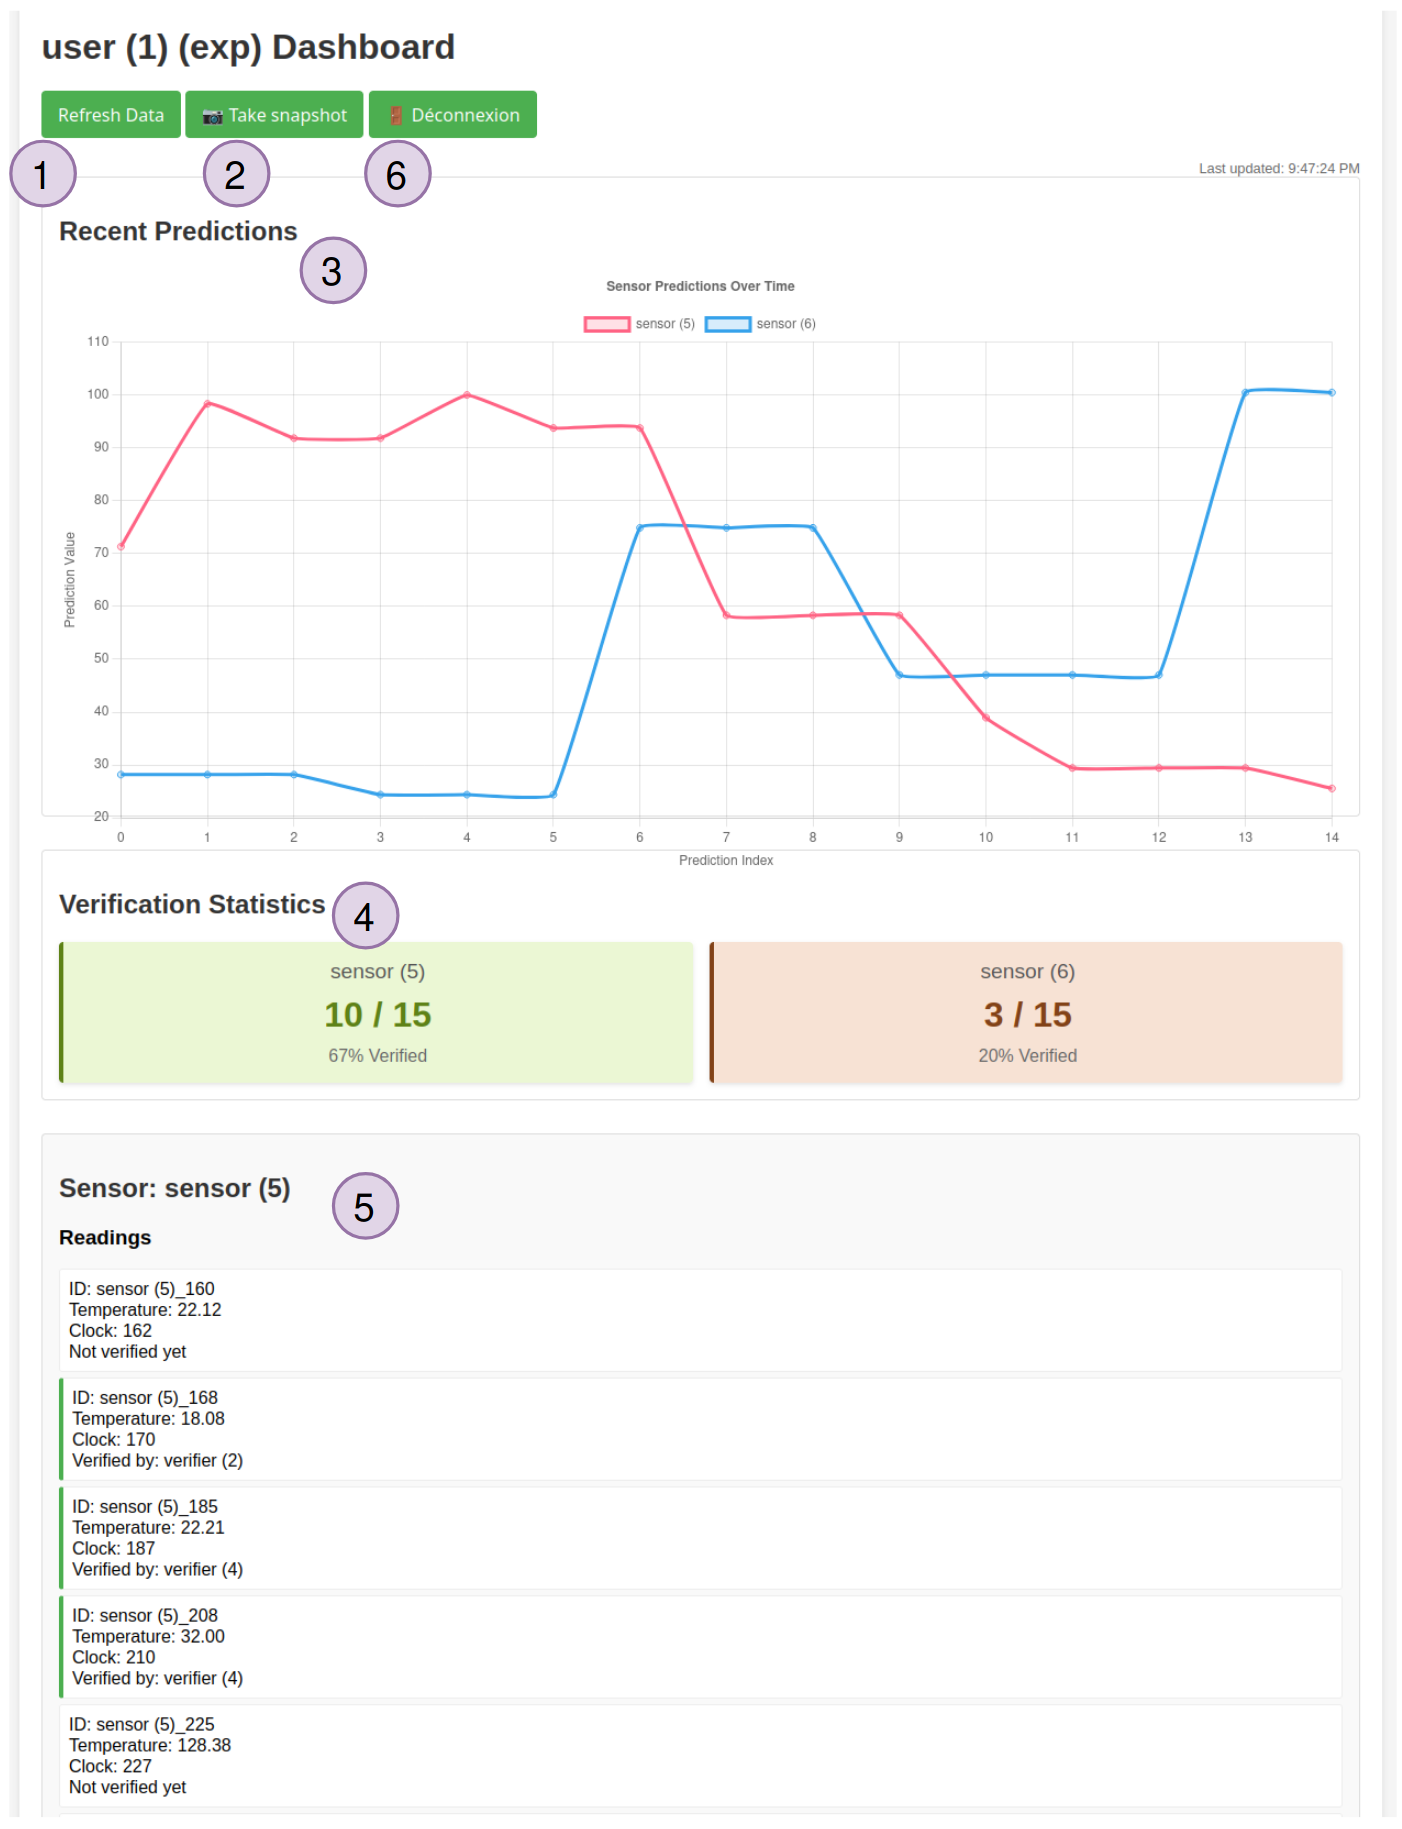
Each user has a web view:
Buttons (1) and (2) are used to refresh the data displayed (which is otherwise done every five seconds) and to take a snapshot, respectively.
The main view (3) shows the last fifteen predictions made by the user for each sensor, differentiated by color.
Below, the view (4) allows to quickly obtain the number of verified values out of the total number of values in the database.
Then, the view (5) lists, for each sensor, the temperatures in the database with the data identifier, the temperature value, and the name of the verifying node that verified it. Verified data is highlighted in green. There are a maximum of 15 values for each sensor (the 15 days of the use case).
Finally, the button (6) allows you to disconnect the user node.
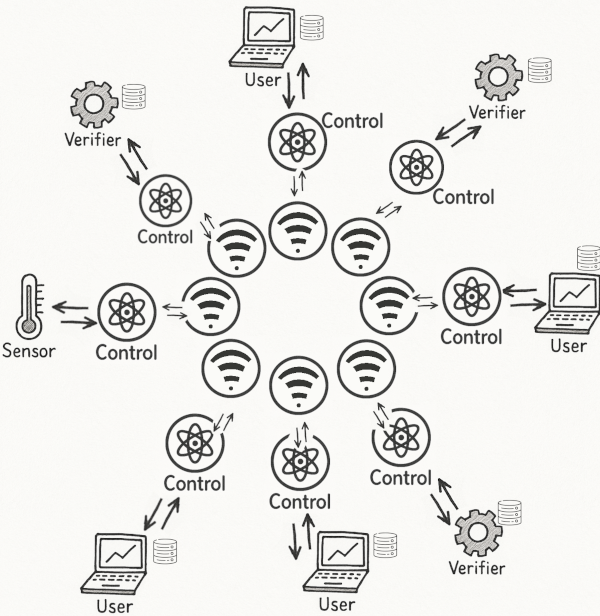
System topology
Bidirectionnal links between network layers. Each of which communicates with the control layer, which in turns communicates with the application layer.
[Project] LLM Knowledge Graph Converter
Keywords: Python, Streamlit, Ollama, LLMs, NetworkX, Plotly, Natural Language Processing, Graph Theory
Presentation
I developed an simple document processing tool that transforms unstructured text into interactive knowledge graphs using Large Language Models. This project combines natural language processing with graph theory to extract meaningful relationships from documents, making complex information more accessible and visually comprehensible. The application features a user-friendly Streamlit interface and supports both English and French document processing.
💭 This project is an exploration of LLM technology, focused on a discovery and learning process rather than production readiness. More advanced pipelines, pretrained models, and dedicated NER libraries like spaCy should be used in a production environment. The current code is a demonstration of my discovery of this technology.
Key Features
Pipeline:
Custom LLM model creation using Ollama with specialized relation extraction prompts
Document fragmentation based on markdown structure for improved precision
Automated entity and relationship extraction from unstructured text
Interactive Visualization System:
- Dynamic knowledge graphs rendered with Plotly and NetworkX
- Smart node positioning using planar or Kamada-Kawai layouts
- Interactive features: zoom, pan, save as PNG, and real-time exploration
- Source/destination labeling system for relationship clarity
Intelligent Processing Optimization:
- Document chunking strategy to maintain model precision on large texts
- Caching system to avoid reprocessing previously analyzed files
- Adaptive processing that creates separate graphs for document sections
- Integrated chat interface for direct LLM interaction
Production-Ready Architecture:
Streamlit web interface for seamless user experience
Local LLM deployment ensuring data privacy
Modular design with custom Ollama model files
Robust file handling for text and markdown formats
Results & Impact
Technical Achievements:
Successfully engineered a text-to-visualization pipeline that converts raw text into structured knowledge representations
Custom model fine-tuning and strategic document segmentation
Intuitive interface
Performance Optimization:
Document fragmentation
Caching mechanism
User Experience Innovation:
Interactive graph visualization enables intuitive knowledge exploration beyond traditional text analysis
Flexible input formats (text/markdown) accommodate diverse document types
Practical Applications:
Research document analysis and literature review acceleration
Legal document relationship mapping
Educational content structuring and comprehension aid
Business process documentation and knowledge management
[Project] TikTok Trends Analysis Project
Keywords: R, RSelenium, Docker, Web Scraping, Statistical Analysis, Data Visualization
Presentation
This project explores the viral mechanics behind TikTok's trending content system. Initially focused on audio trends, I pivoted to investigate what drives the algorithm's selection of trending videos versus regular "For You" page content. Working with a team of three, I developed a comprehensive data scraping and analysis pipeline to decode TikTok's virality patterns.
TikTok pushes trending content to users regardless of their typical interests
Bookmark rates are actually lower for trending content (users save personalized For You content more)
The platform prioritizes rapid diffusion over long-term engagement for trend selection
Example plot: number of comments over time on a video showing pandas 🐼
Technical Impact
This project is the first step to reverse-engineer TikTok's recommendation algorithm through empirical analysis, providing data-driven insights into social media virality mechanisms. The methodology could be adapted for analyzing other platforms' trending systems.
[Study] Information visualization in Virtual Reality
Keywords: Python, Numpy, data interpretation, data processing.
As part of an experimental study for the University of Technology of Compiègne with the Costech laboratory and
ENSADLab, we conducted a virtual reality experiment with a dozen participants.
To date, most data has been presented to users in a two-dimensional space: smartphones,
computers, and tablets are simply planes on which images are displayed.
However, more and more solutions are making the three-dimensional world transposable to the digital realm, thanks in particular to
virtual reality headsets.
It is therefore interesting to observe how users evolve within these immersive environments:
while they are used to evolving digitally on a flat plane, how do they react to digital three-dimensionality
? Do they revert to their real-world reflexes? This study will examine data visualization
through the following question: how does three-dimensional space affect users' perception of image visualization
through image search tasks?
To test these hypotheses, software was developed. Participants were tested on this software and answered a subjective questionnaire. The goal is to use virtual reality to perform visual image searches. To do this, the virtual reality condition (three dimensions) will be compared to the two-dimensional condition, known as “classic” because it corresponds to classic image search on a computer. The objective for participants is to validate (by clicking on a button) as many images as possible corresponding to the target category (such as ‘motorcycles’ or “ducklings”).
Participants were able to move around, zoom in on images, and validate them (2D and 3D conditions). They had five minutes to complete the task. Each participant went through three configurations:
All available data (position, rotation, acceleration, validated images, action, etc.) were recorded every 10 milliseconds.
The purpose of the data analysis is to determine which configuration performs best for image search. The graphs were created using matplotlib.
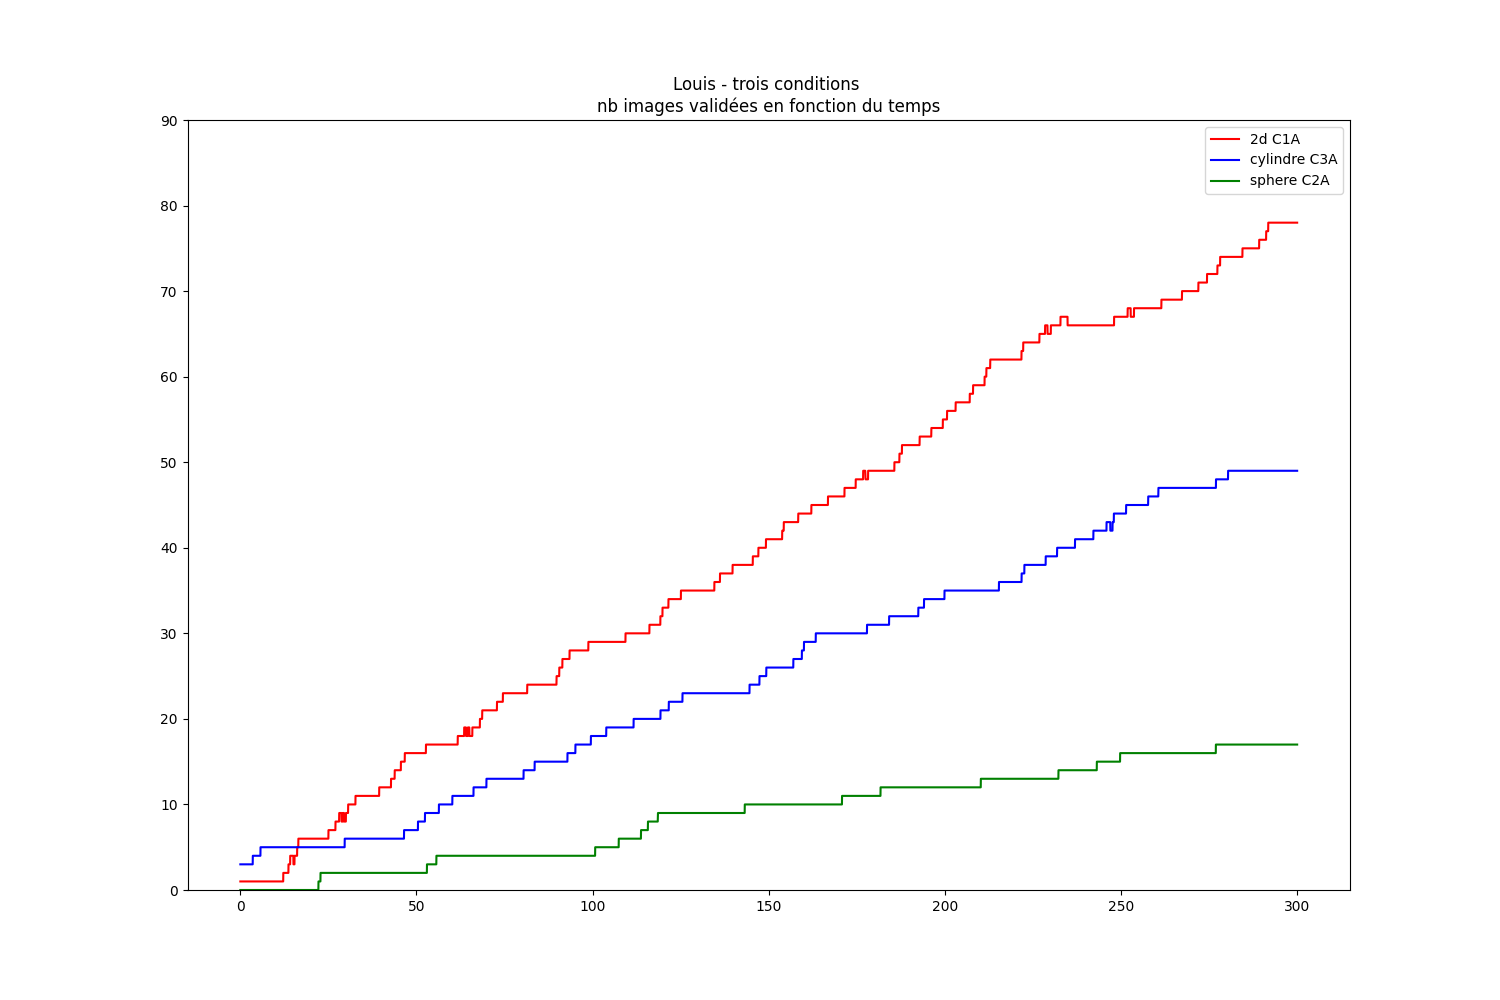
Firstly, the number of validated images is one of the most relevant indicators.
When comparing other factors, it is clear that searching for 2D images is the most effective in the short term: boredom and lack of action will reduce the effectiveness of the search over a longer period of time.
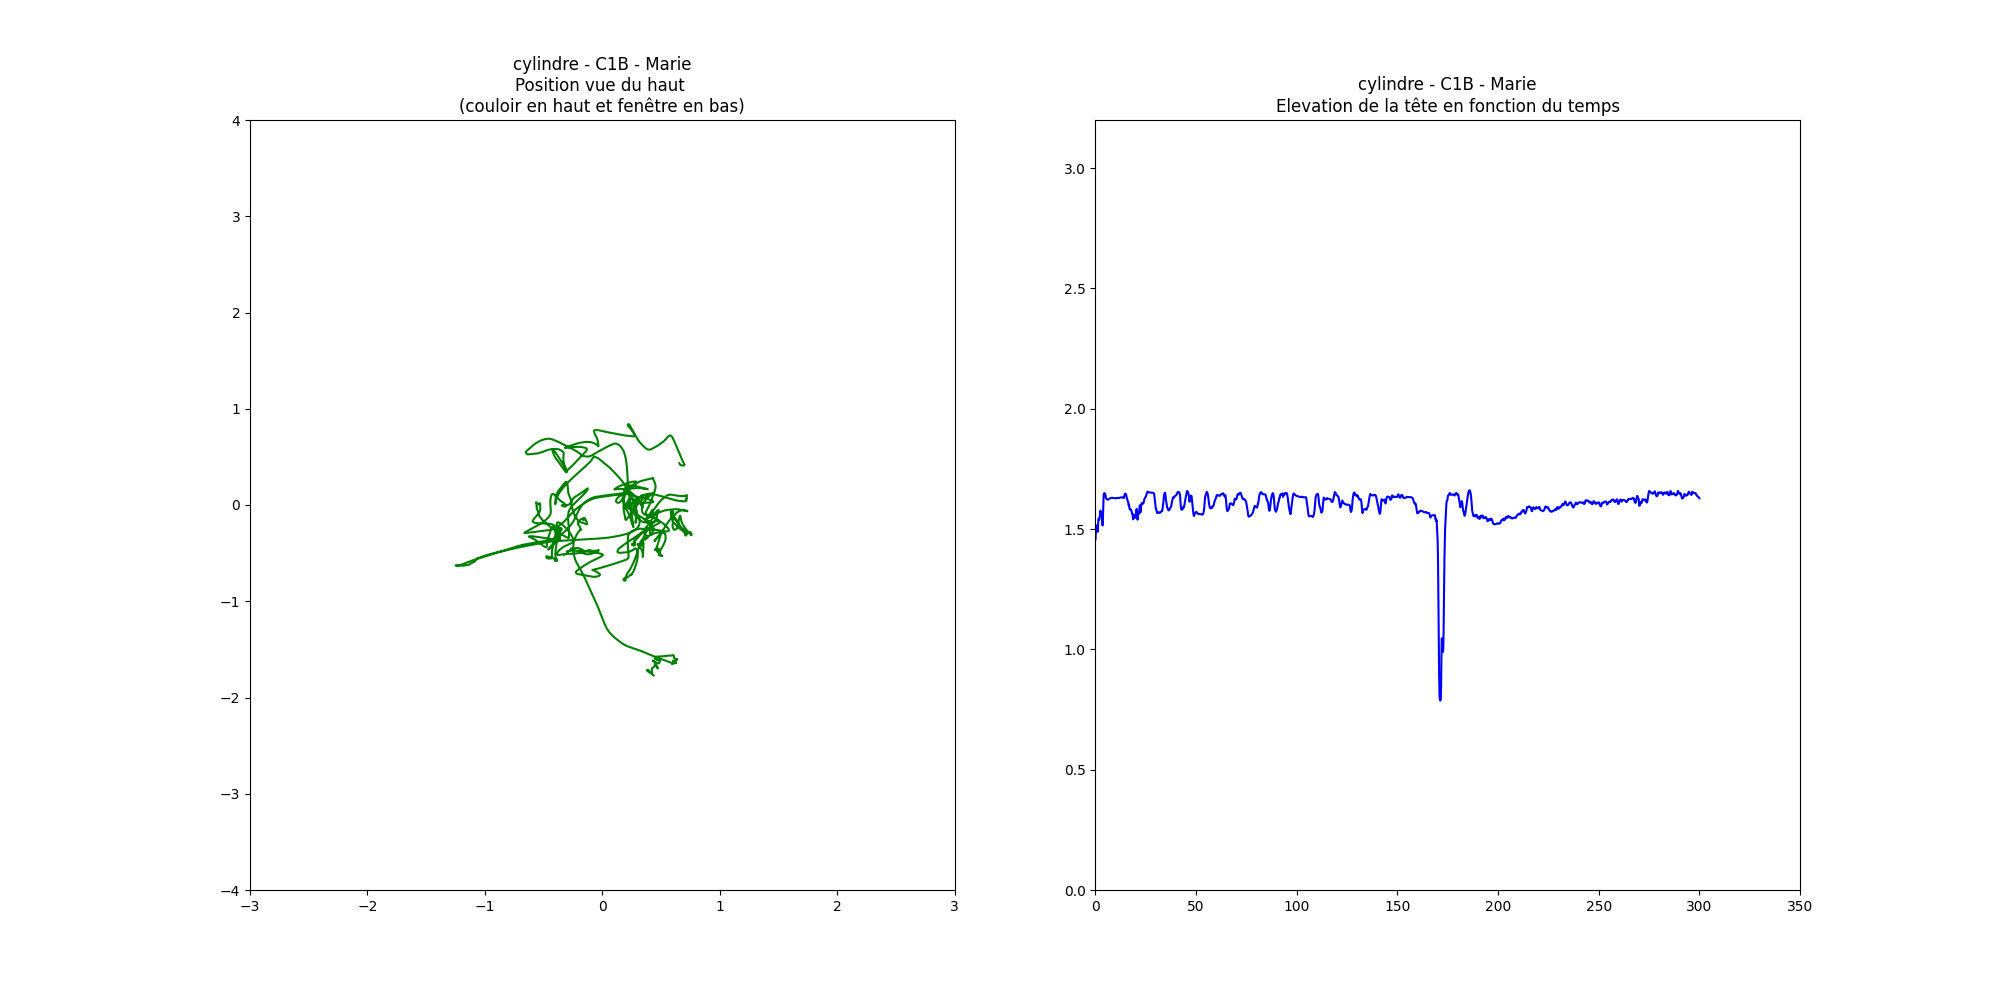
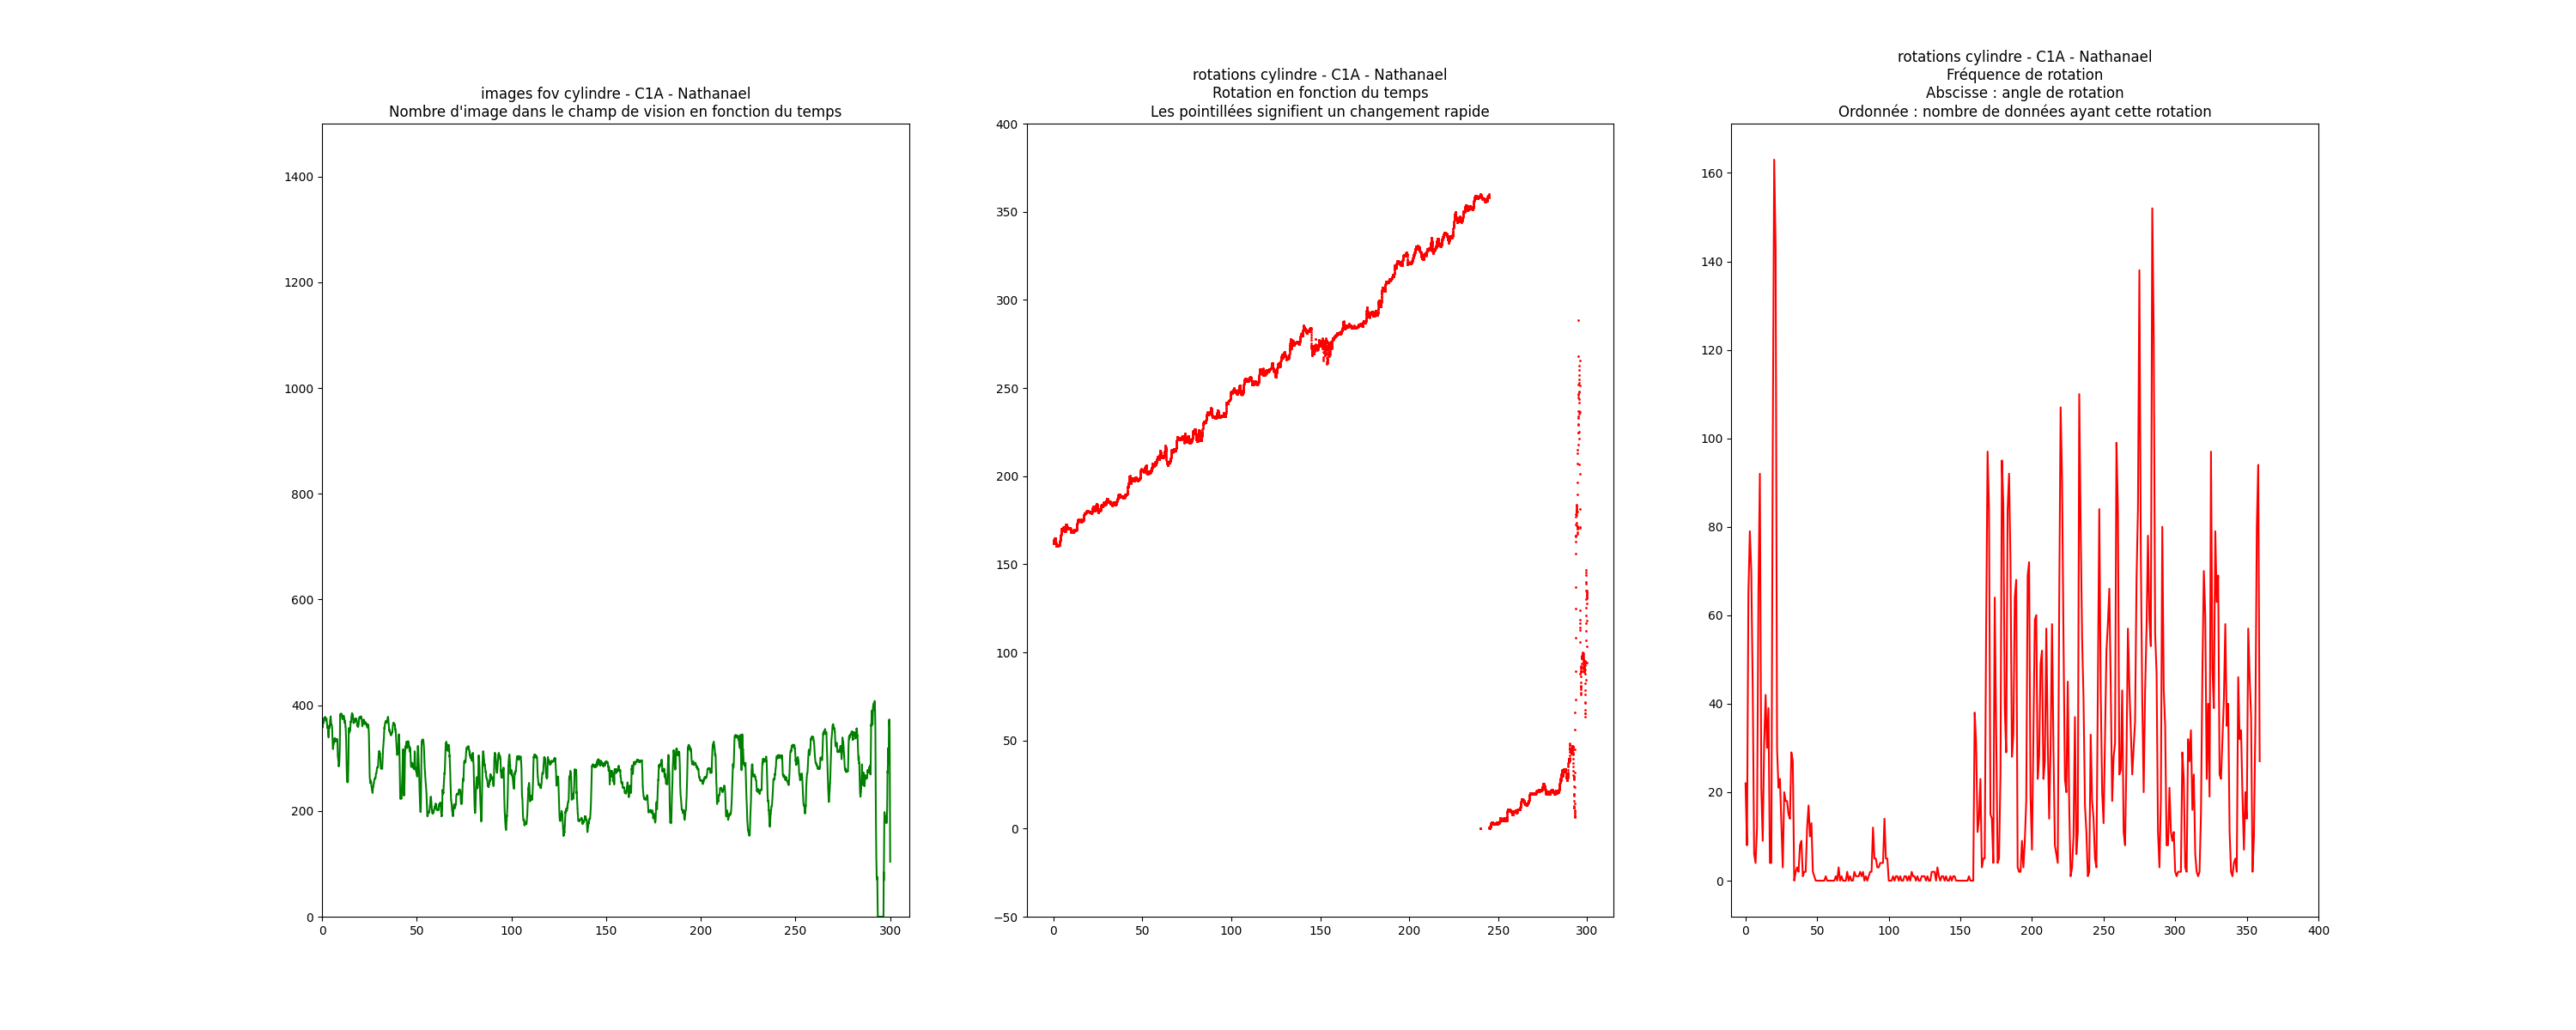
Other data were analyzed, such as
position (3D then 2D): 3D position 2D position:
rotations and their frequencies, the number of images in the field of view:






























 ORCiD
ORCiD




![[PrePrint, WIP] Detection and Classification of Red Blood Cells under flow](img/photos/rbc_flow.gif)
![[Project] AI Grand Challenge 2026 — The Thinking Layer](img/photos/learning_plan_read.png)
![[Project] Explainable Drug-Target Affinity Prediction](img/photos/dta_prediction_mol.png)
![[Project] Disentangling Visual, Semantic, and Factual Deception: A Multi-Branch Approach to Misinformation Detection](img/photos/misinformation_detection/CF_claim.png)
![[Project] High-Resolution Urban Climate Forecasting with Metadata-Augmented U-Net](img/photos/urban_planning_input_2017.png)
![[Project] Distributed Data Sharing System (applied to Temperature)](img/photos/sr05.png)
![[Project] LLM Knowledge Graph Converter](img/photos/llm_kg.png)
![[Project] TikTok Trends Analysis Project](img/photos/tiktok.png)
![[Study] Information visualization in Virtual Reality](img/photos/rv_tamed.jpeg)
 Evaluation on Naples University data. The provided images have vastly different characteristics compared to training data: the cells are more elongated, the image color range is different and the color expression is different as well (cells do not have a white halo-border). A model trained on the same data as before struggles to detect these cells. Future works should create ground truth labels for this data and incorporate these images in the training data.